Choosing the Right Monitoring Stack
When searching for the best Spring Boot monitoring tools review, it’s easy to get lost in the sea of SaaS offerings and open-source frameworks. Monitoring a Java ecosystem requires more than just CPU tracking; it demands deep visibility into the JVM, thread pools, and complex service interactions. In my experience, the right tool is the one that gives you actionable alerts before your users even notice a spike in latency.
Before jumping into third-party solutions, ensure you have mastered the basics. If you are just starting, I highly recommend checking out my spring boot actuator guide to understand the foundational metrics exposed by the framework itself. Once you move into production-grade systems, you will inevitably need distributed tracing with spring boot to track requests across microservices.
Top Contenders Overview
In this review, I am evaluating three categories: APM suites (Datadog/New Relic), open-source stacks (Prometheus/Grafana), and lightweight log-centric tools.
1. Prometheus & Grafana (The Gold Standard)
This remains my favorite stack for most Spring Boot projects. It is powerful, community-driven, and highly customizable.
Strengths
- Unmatched flexibility in dashboard design.
- Massive community support for Spring Boot exporters.
- Cost-effective for high-volume data ingestion.
- Seamless integration with Alertmanager.
- Deep JVM metric capture using Micrometer.
Weaknesses
- High maintenance overhead for self-hosting.
- Steep learning curve for PromQL.
- Storage management can become a headache at scale.
2. Datadog (The ‘Set It and Forget It’ Choice)
If you have the budget and limited DevOps headcount, Datadog is objectively the easiest way to monitor a Spring Boot application.
Strengths
- Auto-discovery of Spring Boot services.
- Out-of-the-box support for tracing and log correlation.
- Excellent UI and UX.
- Zero infrastructure management required.
- High-quality alerting integrations (Slack, PagerDuty).
Weaknesses
- Can become prohibitively expensive at scale.
- Vendor lock-in is a significant concern.
- Data retention policies can feel restrictive on lower tiers.
Performance & User Experience
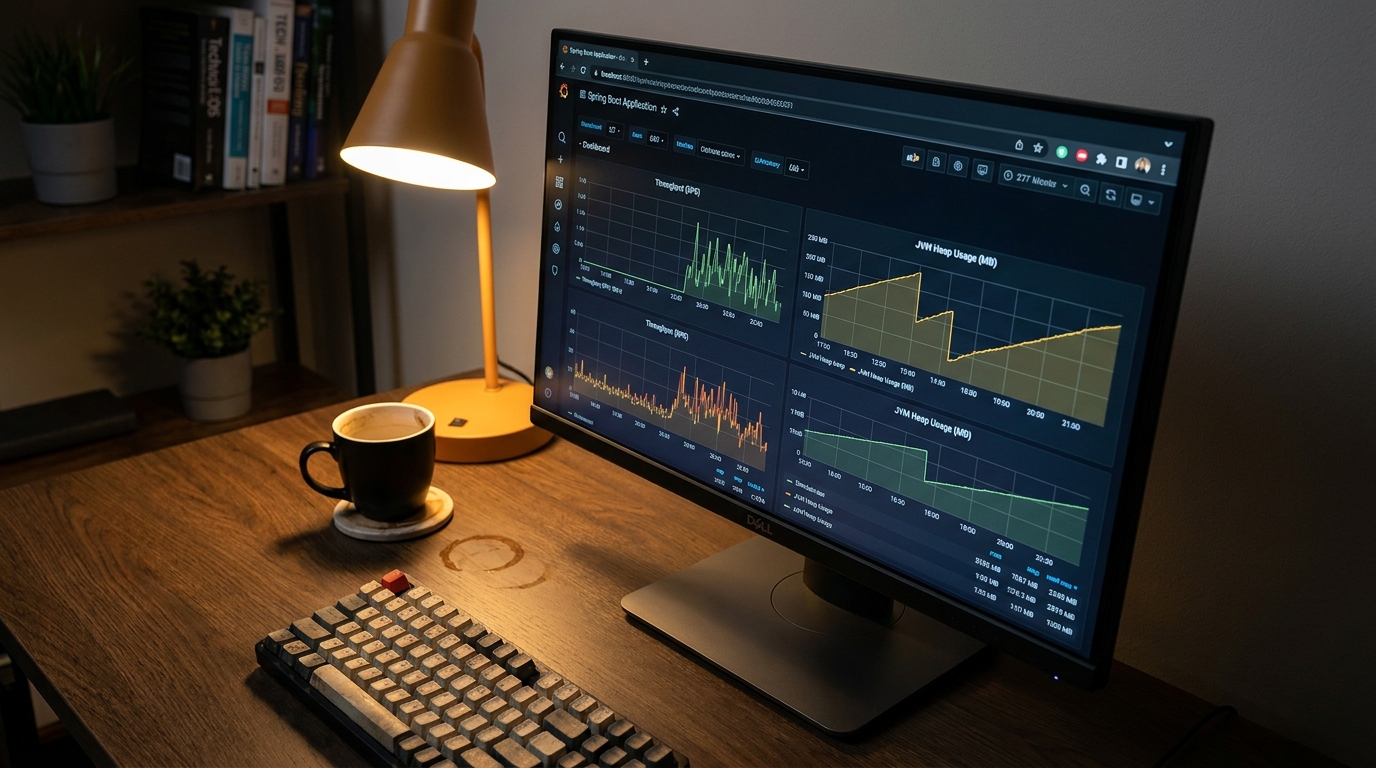
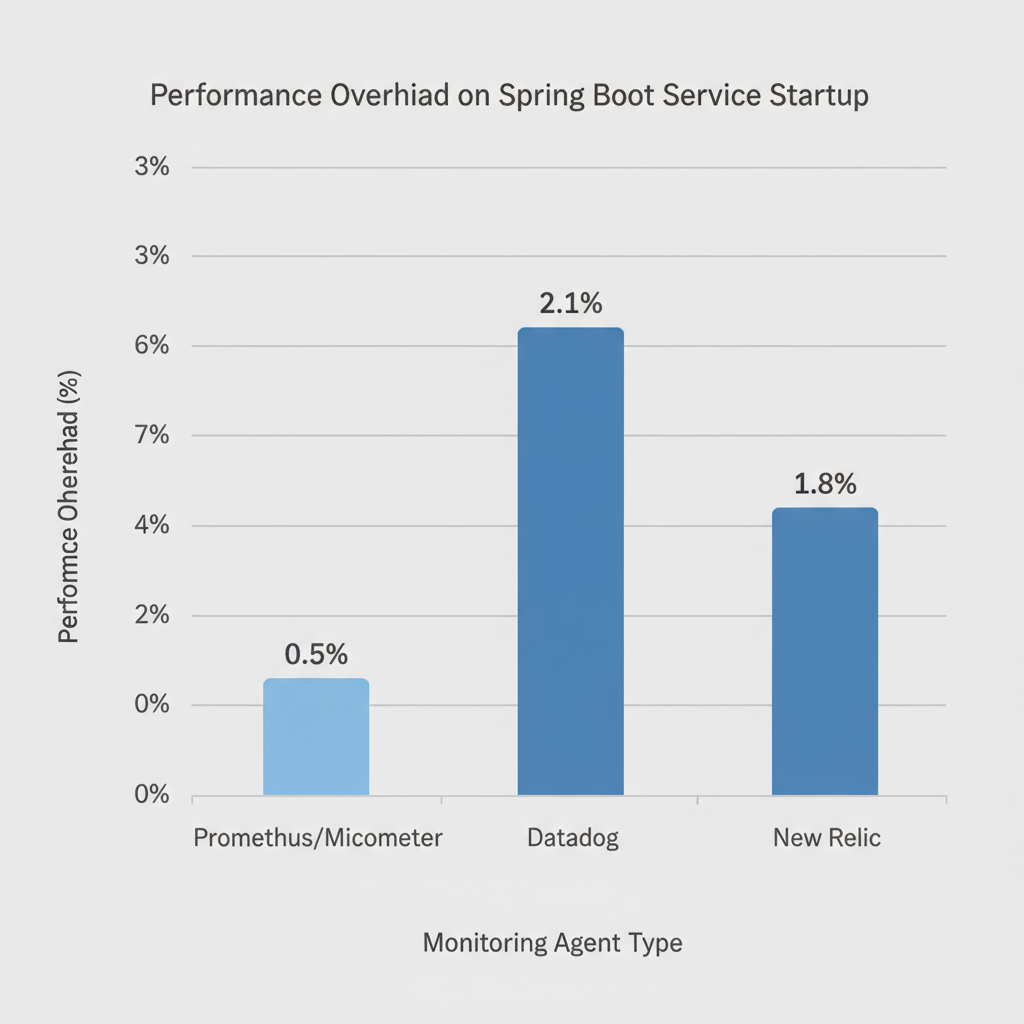
As shown in the image below, comparing internal JVM metrics against external request latency is critical. When testing these tools, I look for how “heavy” the agent is on the application. Prometheus agents, via Micrometer, have a negligible impact on performance, whereas some heavy-weight APM agents can introduce a 3-5% overhead on startup time.
Final Verdict
For most engineering teams, the Prometheus + Grafana combination provides the best long-term value. If you are a startup prioritizing speed of deployment over cost, Datadog will save your team dozens of hours in configuration time.
Ready to level up your observability? Start by implementing Spring Boot Actuator today, and read my deep dive on distributed tracing to catch those hidden production bugs.