
Why Traditional Monitoring Fails LLM Applications
In my experience building production-grade AI agents over the last year, I’ve realized that traditional APM tools like Datadog or New Relic just don’t cut it. When a user says ‘the bot is acting weird,’ a standard 500 error log tells you nothing. You need to see the exact prompt, the retrieval context, the token usage, and the latent reasoning steps. That is why finding the best ai observability tools for developers has become the top priority for engineering teams in 2026.
I’ve integrated dozens of these platforms into my stack. Some are bloated with enterprise features I never use, while others are so minimal they miss critical hallucinations. Whether you are focusing on how to reduce hallucination in ai applications or simply trying to keep your OpenAI bill under control, the right observability suite is your most valuable asset.
The Strengths: What Makes a Great AI Observability Tool?
After testing the top contenders, here are the five core strengths that define the elite tools in this space:
- Deep Trace Visibility: The ability to see nested spans, from the initial API call down to the vector database retrieval.
- Evaluation Frameworks: Built-in tools for evaluating ai accuracy best practices without manual labeling.
- Real-time Cost Tracking: Seeing the exact dollar amount spent per user session or per deployment.
- Prompt Versioning: Linking specific outputs back to the exact version of the prompt template used.
- Low Latency Overhead: Ensuring the monitoring doesn’t slow down the already-heavy LLM responses.
- RAG Visualization: A dedicated UI to see which chunks of data were retrieved for a specific query.
- Dataset Generation: Turning production logs into golden test sets with a single click.
The Weaknesses: The Trade-offs We Face
No tool is perfect. In my testing, I found several recurring pain points:
- Data Privacy Concerns: Sending every prompt and completion to a third-party SaaS can be a non-starter for healthcare or fintech.
- Integration Friction: Some tools require you to wrap every single function in a custom decorator, which litters your codebase.
- Cost Scaling: Many ‘free’ tiers are generous until you hit production, where per-trace pricing can quickly rival your actual LLM spend.
Top Contender 1: LangSmith (The Powerhouse)
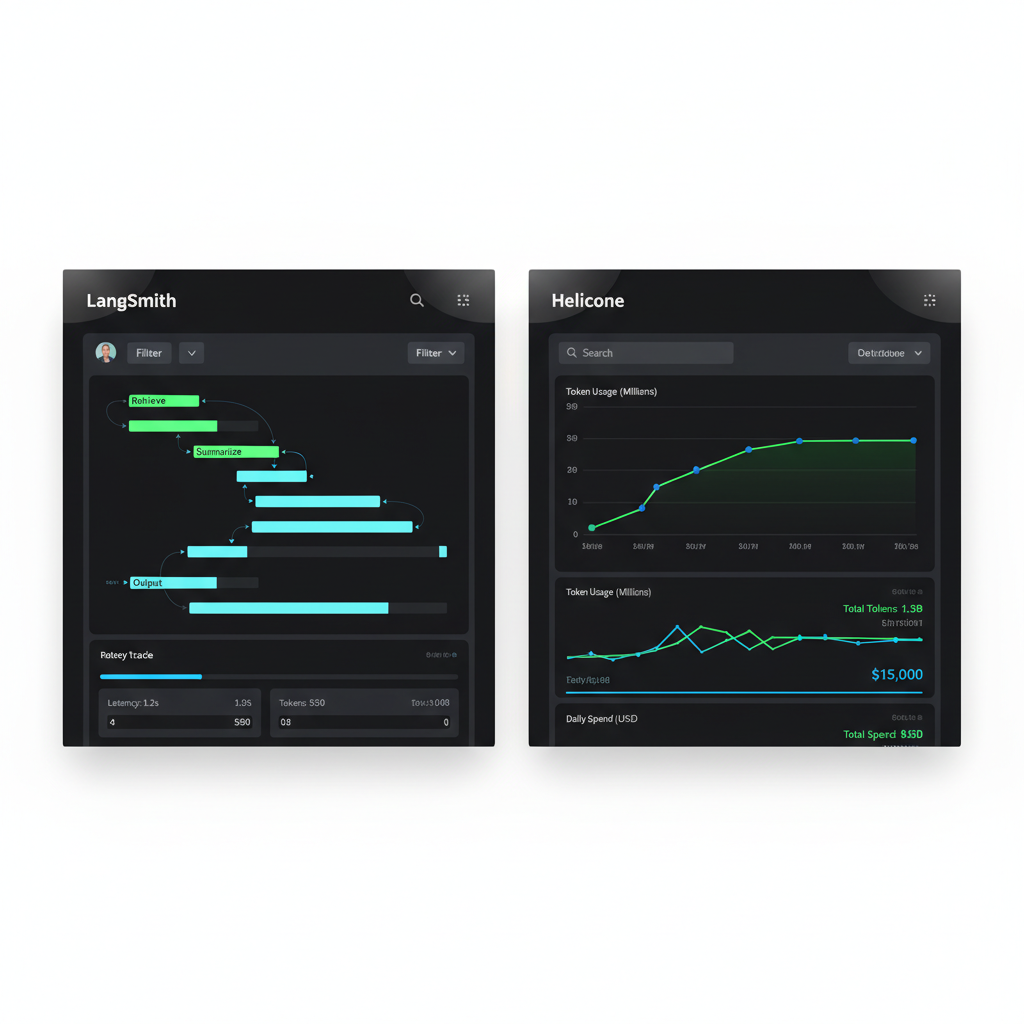
As part of the LangChain ecosystem, LangSmith is arguably the leader. I use it daily because its ‘Trace’ feature is unmatched. You can see the flow of data through chains and agents in a visual format that makes sense to humans, not just machines.
Performance and User Experience
LangSmith’s UI is incredibly polished. The ‘Playground’ feature allows you to take a failed production trace and tweak the prompt immediately to see if you can fix the issue. It’s an essential part of the top 10 ai devtools for engineering teams list for a reason. However, the performance overhead is noticeable if you aren’t using their asynchronous logging correctly.
Top Contender 2: Arize Phoenix (The Open Source King)
If you are worried about data privacy, Arize Phoenix is the best choice. It’s open-source and runs locally in a notebook or as a container. I found it particularly useful for visualizing embedding clusters to see where my model was losing its way.
Top Contender 3: Helicone (The Minimalist)
Helicone works as a proxy. You just change your baseURL in your OpenAI or Anthropic client. It’s the least intrusive of the best ai observability tools for developers. You get great charts on latency and cost with zero code changes, though you lose the deep nested tracing that LangSmith provides.
Comparative Performance and Pricing
Choosing a tool often comes down to the balance of features vs. overhead. Here is how they stack up in my internal benchmarks:
| Tool | Integration Difficulty | Key Feature | Pricing Structure |
|---|---|---|---|
| LangSmith | Moderate | Visual Debugging | Usage-based (Free tier available) |
| Arize Phoenix | High | RAG Evaluation | Free (Open Source) / Enterprise SaaS |
| Helicone | Very Low | Proxy-based Analytics | Generous Free Tier / Pro Monthly |
User Experience: A Developer’s Perspective
In my workflow, the UX isn’t just about pretty buttons; it’s about how fast I can find the ‘needle in the haystack’ when an LLM fails. LangSmith wins on searchability. I can filter traces by ‘feedback score’ or ‘token count’ in seconds. Arize Phoenix wins on technical depth, providing UMAP visualizations that help me understand my vector database’s performance. When it comes to evaluating ai accuracy, having a tool that integrates directly into your CI/CD pipeline is the ultimate UX win.
Who Should Use Which Tool?
- Startups/Prototypes: Go with Helicone. It takes 30 seconds to set up and provides immediate cost visibility.
- Complex Agentic Workflows: Use LangSmith. You need to see exactly which step in a 10-step agent loop failed.
- Enterprise/Privacy-Sensitive: Use Arize Phoenix or Parea AI (self-hosted). Keep your data on your own infrastructure.
- Research & Fine-tuning: Use Weights & Biases. Their lineage tracking for datasets is superior for the training phase.
Final Verdict
After a year of testing, the best ai observability tool for developers who want the total package is LangSmith. Its ability to move from debugging to testing to monitoring in one unified interface is currently unmatched. However, if you are building a simple RAG app and want to save money, Helicone is my runner-up for its ‘set it and forget it’ simplicity. Don’t ship an AI app without one of these; flying blind is the fastest way to lose user trust.
If you’re still in the early stages of building, check out my guide on ai devtools for engineering teams to round out your stack.