Introduction
In the rapidly evolving landscape of 2026, building a functional backend is no longer enough. As cloud costs climb and user expectations for sub-millisecond latency become the norm, spring boot 3 performance optimization has transitioned from a ‘nice-to-have’ to a core engineering requirement. I’ve spent the last few months benchmarking the latest releases, and I can tell you: the gap between a default configuration and an optimized one is massive—often a 40-60% difference in resource utilization.
The Challenge: Why Spring Boot Apps Feel Heavy
Traditionally, Spring Boot has faced criticism for its heavy memory footprint and slow startup times. In a world of serverless functions and micro-scale containers, these ‘fat’ JARs become a liability. The challenge isn’t just the framework; it’s how we manage thread exhaustion, reflection-based overhead, and inefficient caching. If your application takes 10 seconds to start and consumes 500MB of RAM just to say ‘Hello World’, your scaling strategy is fundamentally broken.
Solution Overview: The Three Pillars of 2026 Optimization
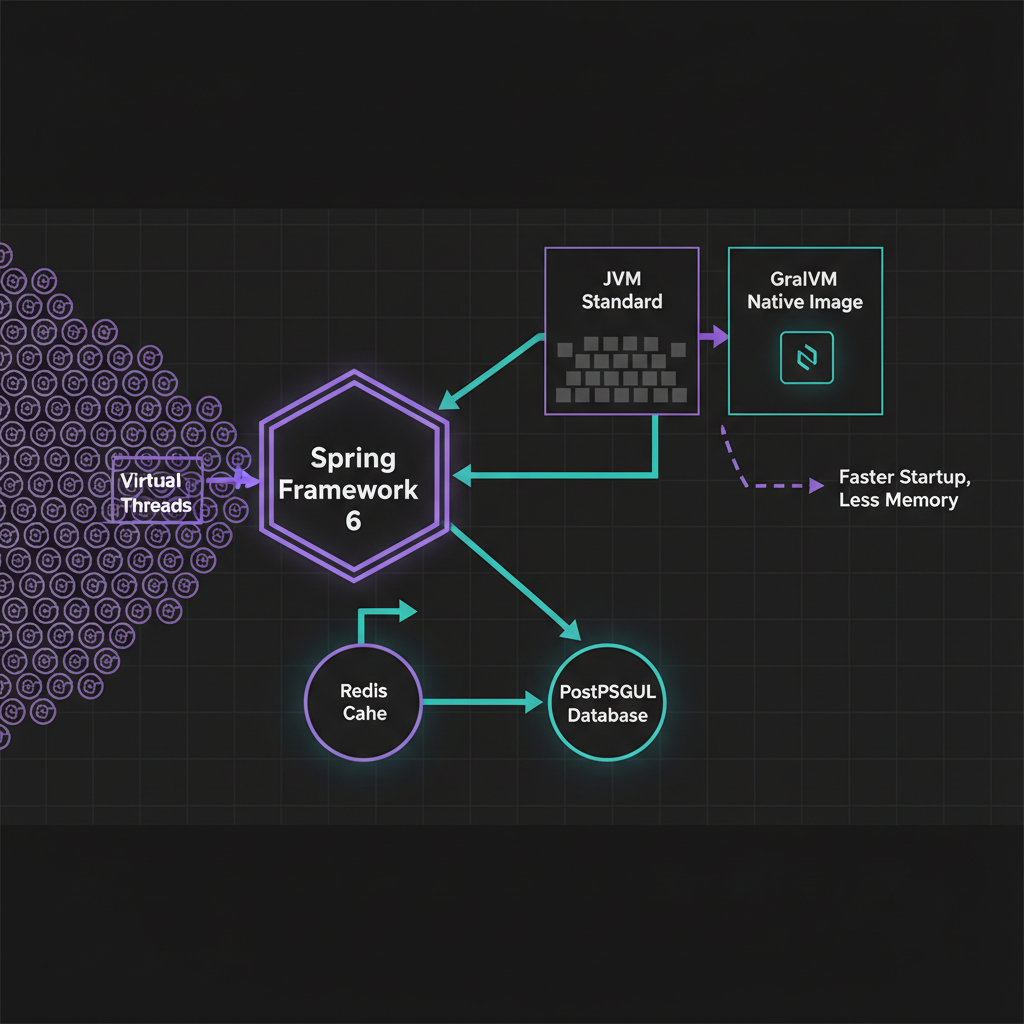
To tackle these challenges, we focus on three specific areas: execution model (Virtual Threads), packaging (Native Images), and runtime warmups (CDS). By combining these with a robust spring boot redis caching strategy, we can create resilient, lightning-fast services.
Technique 1: Harnessing Virtual Threads (Project Loom)
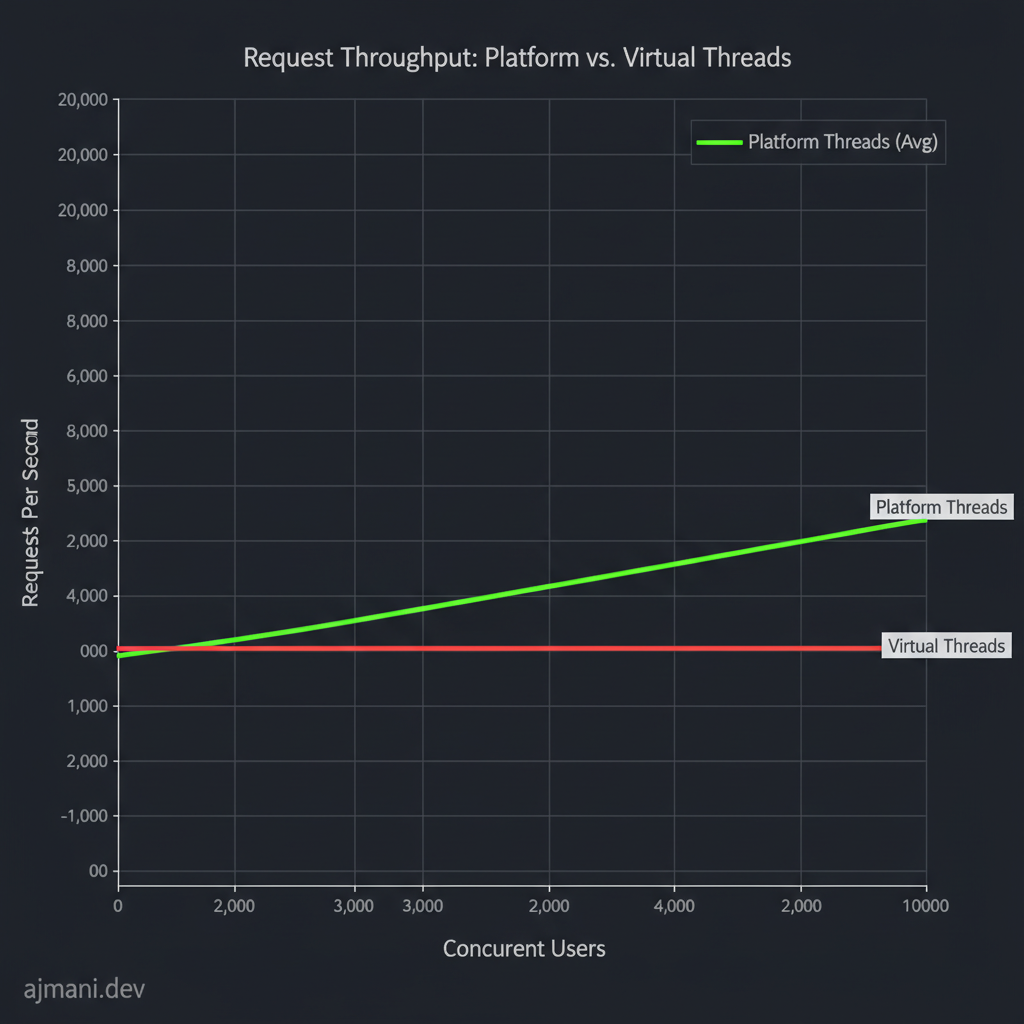
The most significant leap in Spring Boot 3.2+ is the first-class support for Virtual Threads. Unlike traditional OS threads, which are expensive to create, virtual threads are lightweight and managed by the JVM. In my experience, switching to virtual threads is the single most impactful change for I/O-bound applications.
# Enable Virtual Threads in application.properties
spring.threads.virtual.enabled=true
As I detailed in my spring boot virtual threads tutorial, this configuration allows your app to handle thousands of concurrent requests without the dreaded OutOfMemoryError: unable to create new native thread. Here is what the performance shift looks like under high load:
Technique 2: GraalVM Native Images
If you are running in a Kubernetes environment, startup time is everything. GraalVM transforms your Spring Boot application into a platform-specific native executable. This eliminates the need for a JVM at runtime, reducing startup time from seconds to milliseconds. However, it requires an Ahead-of-Time (AOT) compilation step that can be tricky with libraries relying heavily on reflection.
Technique 3: Class Data Sharing (CDS)
Not everyone can go ‘Native.’ For many, spring boot 3 performance optimization involves CDS. CDS allows the JVM to record the state of loaded classes and reuse that ‘archive’ in subsequent starts. In my testing, this reduces startup time by 20-30% without the complexity of GraalVM.
# Step 1: Create the archive
java -Djarmode=layertools -jar app.jar extract
java -XX:ArchiveClassesAtExit=app.jsa -jar app.jar

# Step 2: Use the archive for faster startup
java -XX:SharedArchiveFile=app.jsa -jar app.jar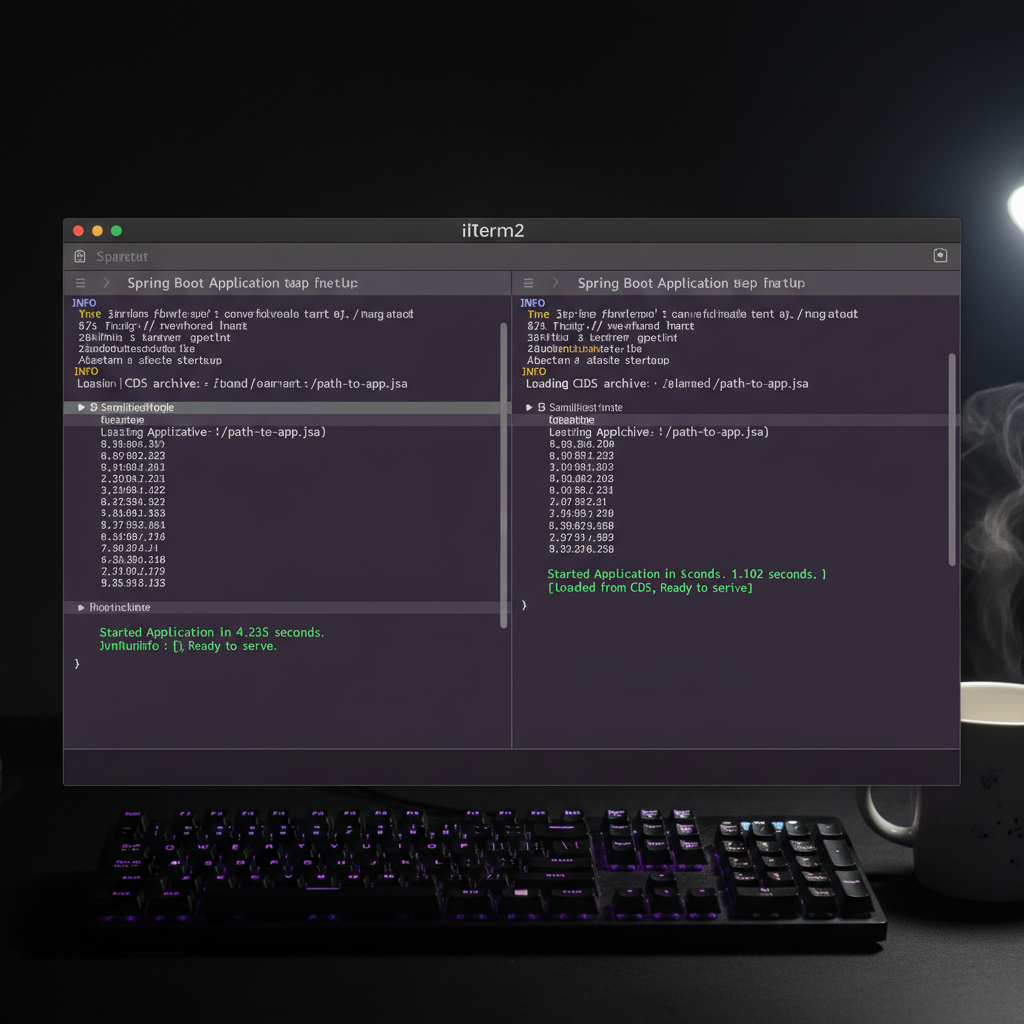
Implementation: A Practical Tuning Checklist
When I start a new optimization project, I follow this sequence:
- JVM Version: Always use Java 21 or later. The G1 garbage collector improvements alone are worth the upgrade.
- Dependency Audit: Remove ‘starter’ dependencies you don’t use. Each additional library increases the classpath scanning time.
- Connection Pooling: Tune HikariCP. Most developers leave
maximum-pool-sizeat 10, which is often too low for high-traffic apps. - Observability: Use Micrometer to track the ‘p99’ latency. You can’t optimize what you don’t measure.
Case Study: Reducing AWS Lambda Costs by 45%
I recently worked with a client whose Spring Boot microservices were timing out on cold starts in AWS Lambda. By implementing GraalVM Native Images and optimizing their java microservices architecture, we reduced their memory allocation from 1024MB to 256MB. Their billing dropped by nearly half, and the ‘cold start’ became indistinguishable from a ‘warm’ request.
Common Pitfalls to Avoid
The biggest mistake I see is ‘premature optimization.’ Don’t switch to Native Images if you are still in active development, as the build times will frustrate your team. Also, be wary of over-caching; a poorly managed distributed cache can lead to stale data that is harder to debug than a slow database query.
For more on infrastructure, check out my guide on optimizing JVM heap settings and Docker performance tuning for Java.