Trading indicators look brilliant on a chart you picked after the fact. The only honest way to know whether a rule works is to test it on data it has never seen, with realistic costs, and to write down what you assumed. CasaTrend is the stock backtesting platform I built for the Casablanca Stock Exchange to do that: it collects prices every evening, scans for trend signals, sends alerts, and runs reproducible research experiments on the full history.
This article covers how the system is built, step by step, and what the research found. It is an engineering case study, not investment advice.
The project at a glance
| What it does | Daily price collection, signal scanning and email alerts, portfolio and holdings tracking, strategy research with stored, reproducible experiments |
| Data | 74 listed stocks (67 used in research), about 235,000 daily price rows going back to 1999 |
| Backend | Java and Spring Boot, MongoDB, scheduled jobs, Selenium with headless Firefox for collection |
| Security | Single sign-on through Keycloak (OpenID Connect) |
| Deployment | GitHub Actions builds a Docker image, pushes it to GitHub’s registry and deploys it over SSH to a VPS behind Traefik; the server never holds the source code |
The problem: small markets, scattered data, optimistic backtests
The Casablanca market is small and its data is harder to get than for US stocks. Free sources offer charts, not clean history you can query. And most strategy tests you find online share three flaws: they ignore commissions and slippage, they tune parameters on the same data they report results on, and they never say what was assumed. I wanted a tool that fixes all three, and that runs on its own every evening without me opening a chart.
Step 1: Collect the data every evening, automatically
A scheduled job runs after the market closes, in the market’s own time zone, on weekdays:
@Scheduled(cron = "${batch.cron}", zone = "${batch.zone}")   // 0 0 18 * * MON-FRI, Africa/Casablanca
public void nightlyBatch() {
    signalBatchService.runAndWait("schedule");   // update prices, then look for new signals
}
The price source only serves its historical data to a real browser session, so the collector drives headless Firefox with Selenium and reads the data the page itself requests. That decision shaped the deployment: the Docker image contains Java and Firefox, and I measured its memory use with the real data before choosing the server limits (it peaked at 1.4 GB under a 2 GB cap).
Every batch run is recorded with its start, end and result, so a failed evening shows up in the dashboard instead of silently leaving a gap in the data. Before any research run, a data quality service checks every stock’s stored history as collected and reports which stocks the run may use and why the others are left out. It only counts; it never silently “repairs” or deletes data.
Step 2: Signals and alerts
After the prices are updated, the same batch evaluates each stock with the trend rules the user follows and sends an email when a new signal appears. The app also covers the day-to-day side: holdings and portfolio tracking, a manual trading journal, intraday bars, and notification settings per user. The point is that the platform does the routine checking, and a person only looks when something has changed.
Step 3: A research engine that can be trusted
The research engine is a pure Java component: it receives prepared price series and returns results, with no database or network calls inside. That makes it fast and easy to test. Each experiment is defined by explicit, typed settings:
public record Costs(double commissionPct, double minFee, double slippagePct) { ... }

public record Execution(double capital, double positionFraction, int maxFillGapDays,
                        double priceLimitPct, boolean fillAtClose) { ... }

public record Rules(boolean relVolume, boolean maTrend, boolean marketUp,
                    double minTradedValue, String confirm, ...) { ... }
Costs, fills and rules are part of the experiment, not hidden defaults. You cannot run a test without deciding what a trade costs, whether orders fill at the close of the signal day or at the next open, and how many days of missing data are acceptable for a fill.
Step 4: Make every experiment reproducible
Results are only worth something if you can reproduce them. Every stored experiment records its formula version and a fingerprint of the exact dataset it ran on:
formula   range-filter-close/ema-smooth-2p-1/v3-daily-or-weekly-bars
dataset   67 stocks, 64028 rows, to 2026-10-09, sha256:fe4e3f2da66b380a
If the data changes (a new month of prices, a corrected row), the fingerprint changes too, and two results are never compared as if they came from the same input.
Step 5: Train, validation and test, like a machine learning project
The history is split in time: parameters are explored on the oldest segment (to 2016), checked on a validation segment (to mid-2021), and only then reported on the most recent, untouched test segment. A whole grid of parameter settings (56 combinations) is run, not just the one that looks good, and each stock is traded with the same fixed amount so a few large positions cannot dominate.
What the research showed
The experiments tested a trend-following indicator, the Range Filter, in two setups. The two gave opposite pictures, and the difference between them was the main finding:
- Weekly bars without costs: the default setting made money in every segment, and on the test segment 68% of the stocks it traded ended in profit. It looked excellent.
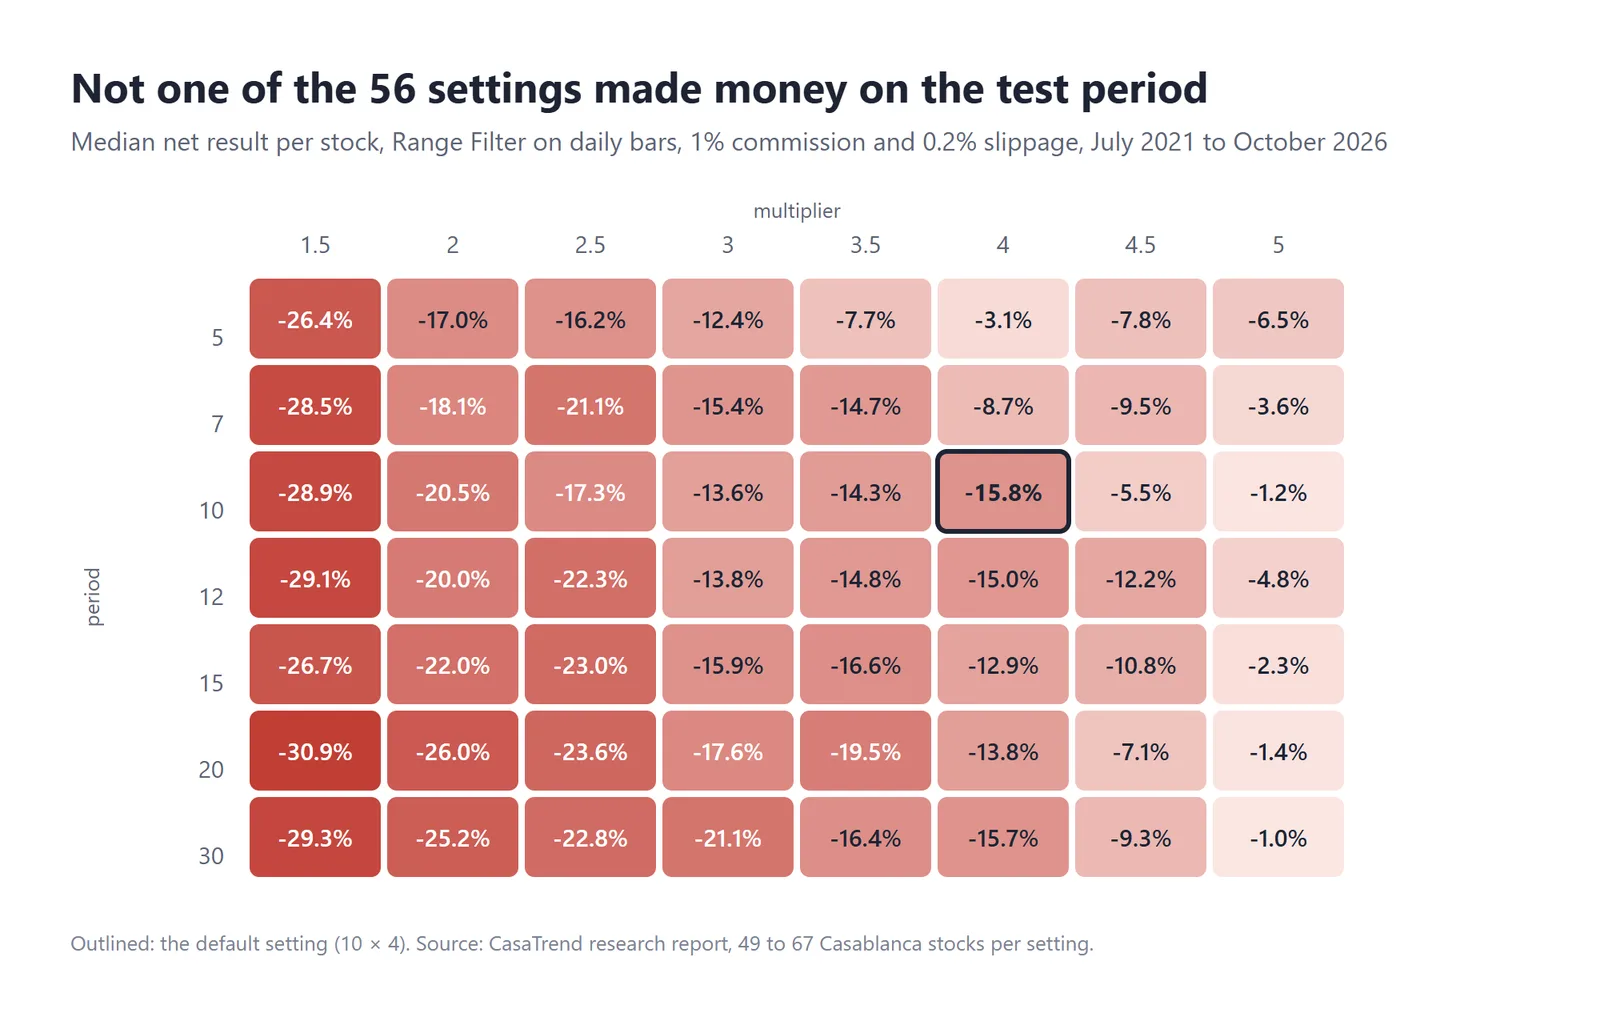
- Daily bars with realistic costs (1% commission, 0.2% slippage, fills at the next session) reversed the picture. The default setting lost money on the typical stock and beat buy-and-hold on fewer than one stock in five. None of the 56 settings had a positive median result on the untouched test segment. Its break-even commission was about 0.7% per order, and a 30 MAD minimum fee per order was enough to wipe out a small 2,000 MAD account.
Three more results were more useful than any single return figure:
- Tuning did not help. The ranking of the 56 settings on the training data said nothing about their ranking later (a rank agreement of −0.30). The best setting in training ranked 44th of 56 on the test data, and re-picking the best setting every year did worse than simply keeping the default more often than not.
- It trailed buy-and-hold on most stocks in the test period (it beat it on 39% of them), while being invested only about a third of the time. Whether that trade-off is attractive is a personal decision, not a statistical one.
- A few very large winners carried the average. The typical stock made +13.5% on the test segment while the average was much higher, which is exactly the kind of detail a single headline number hides.
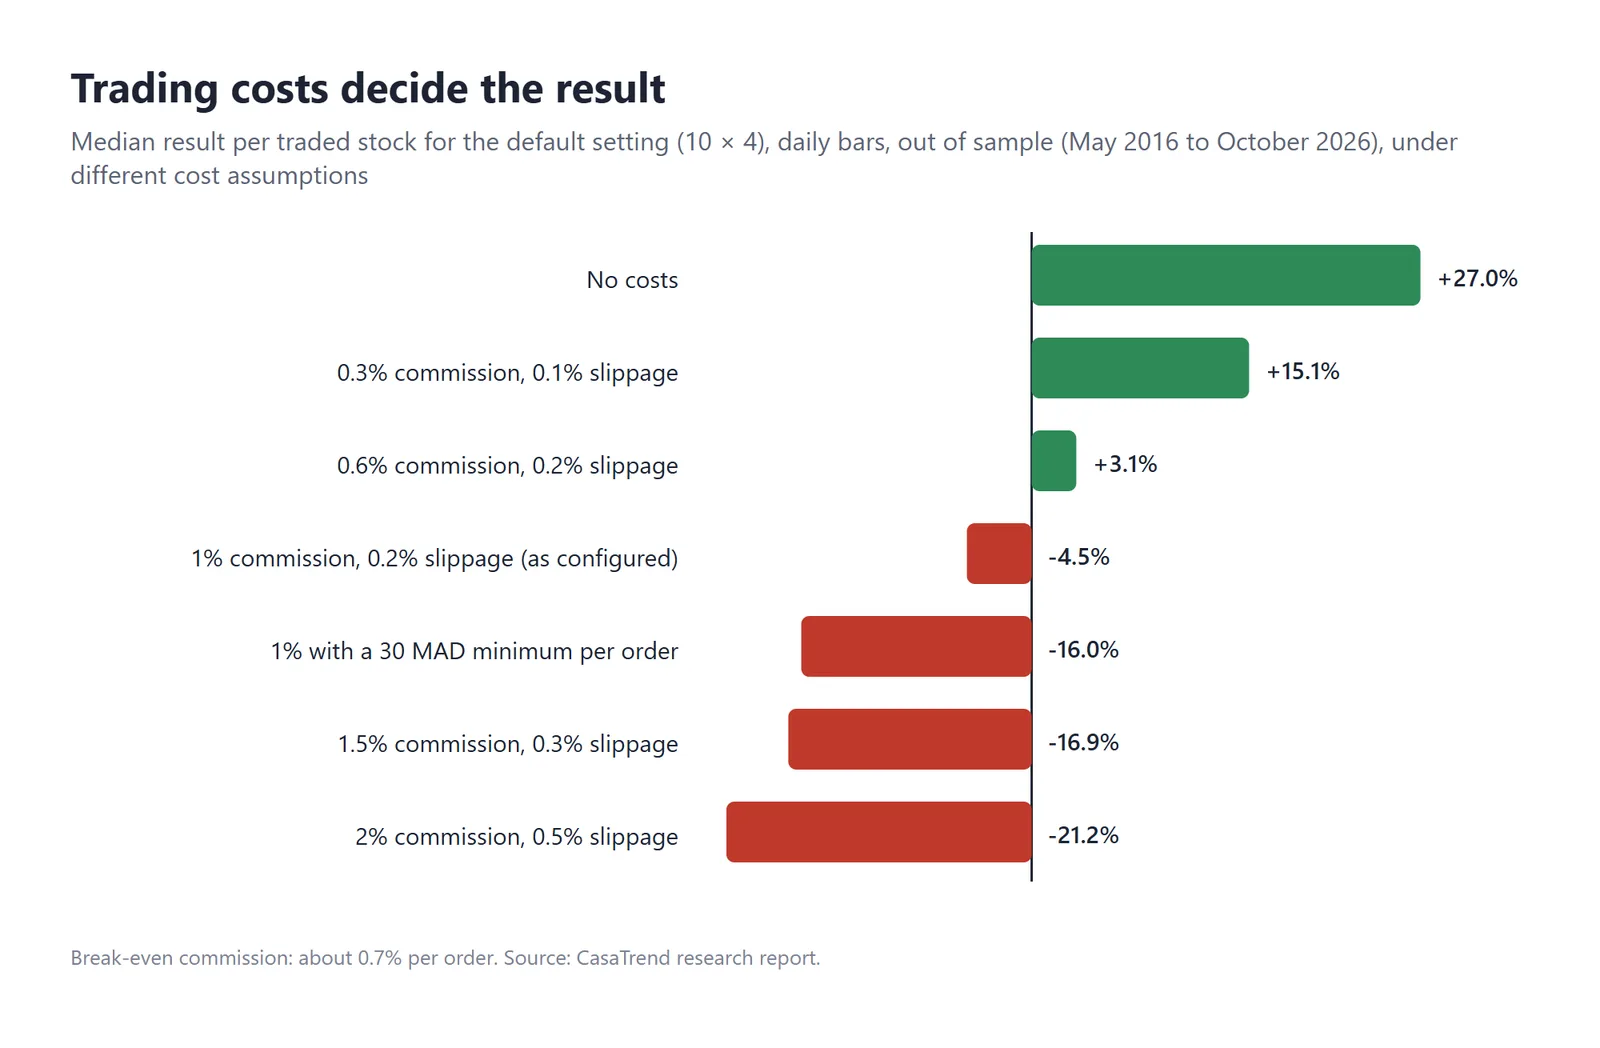
Because no candidate survived out-of-sample validation, no trading script was written for it: the brief said to build one only if the evidence supported it. The research report separates what was measured from what was assumed, and states that nothing in it is a recommendation to trade. For anyone building analytics, that separation is the most important habit to copy.
Step 6: Deployment without source code on the server
Every push to the main branch runs a pipeline:
- GitHub Actions builds the Docker image and stores it in GitHub’s container registry.
- It copies the production Compose file to the server.
- Over SSH, the server pulls the new image and restarts the container behind Traefik, which handles HTTPS.
The server only holds two files: the Compose file the pipeline sends and an .env written once by hand with permissions 600. Sign-in goes through Keycloak, so the app has no password storage of its own and other tools can share the same accounts.
Lessons from building a stock backtesting platform
- Automate collection first. An analysis that depends on someone downloading a CSV every week stops happening.
- Record every run. Batch history and data quality checks turn silent failures into visible ones.
- Put assumptions in the code’s types. Costs and fills as required parameters cannot be forgotten.
- Split by time and report out-of-sample. Anything tuned and reported on the same data is a sales pitch, not a result.
- Write down negative results. “This does not survive costs” is valuable knowledge that saves money.
Need a data platform like this?
The same building blocks fit far more than stock markets: collecting prices or listings from websites every day, cleaning and storing them, alerting when something changes, and giving your team dashboards and research tools they can trust. I can build the collection, the storage, the analysis and the deployment, and write down clearly what the numbers do and do not mean.
More on this topic: Data and BI tools, every comparison and guide in one place.
Official resources for stock backtesting platform
Documentation and references for stock backtesting platform: